Back to journal
Data & Analytics22 Sept 2026
Turning Spreadsheets into Power BI Dashboards: A Travel Agency Reporting Guide
Tendai Gumunyu8 min read
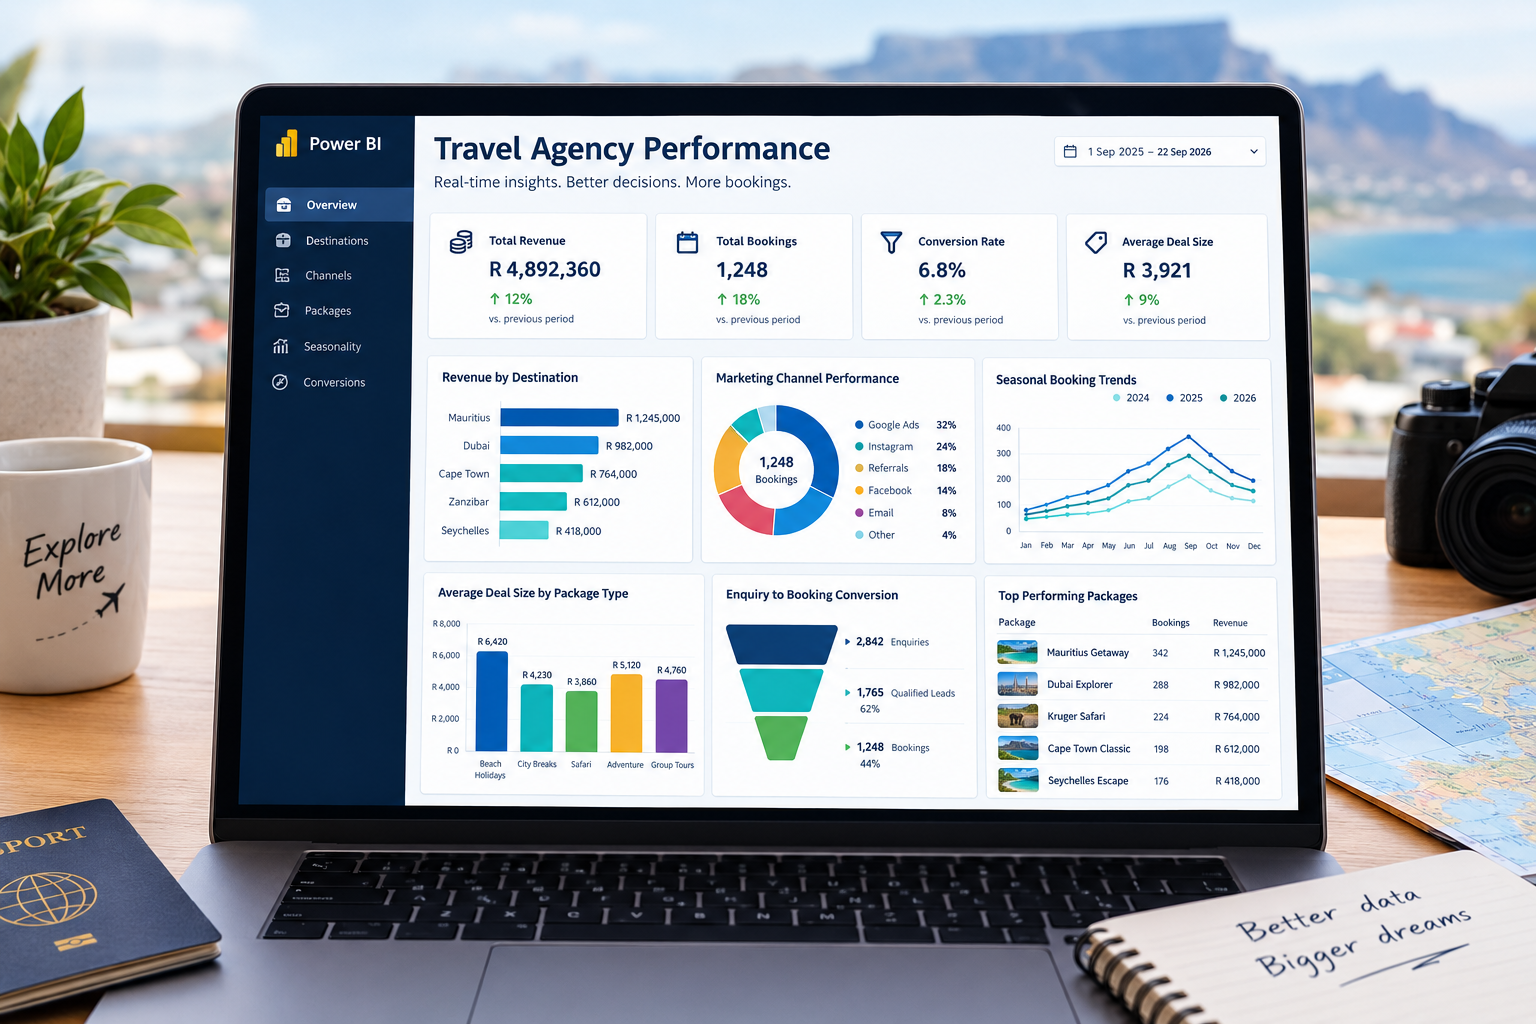
Learn how South African travel agencies use Power BI to turn scattered spreadsheet data into live dashboards that reveal which destinations, channels, and packages actually drive revenue.
If your travel agency's reporting still lives in spreadsheets, bookings in one tab, revenue in another, someone manually reconciling numbers once a month, you are making decisions on data that is already weeks old.
This guide walks through how a Power BI dashboard fixes that, and what it actually looks like in practice.
The problem with spreadsheet-based reporting
Spreadsheets work fine at a small scale, but they break down fast as a travel agency grows.
Data lives in silos across different files.
Formulas break when someone edits the wrong cell.
And because updating the numbers is manual and time-consuming, reporting happens monthly at best, which means the business is always reacting to last month's problems instead of catching this week's.
There is also a visibility problem.
A spreadsheet full of rows and columns does not make patterns obvious.
A dip in bookings from a particular channel, a destination quietly outperforming everything else, a seasonal trend starting two months early this year, all of that is buried in raw numbers until someone has time to dig through it manually.
What a Power BI dashboard actually shows you
A dashboard connected directly to your booking data, whether it lives in spreadsheets, a Supabase database, or a booking platform export, answers the questions an agency owner actually needs answered, and it does it live rather than once a month:
Revenue by destination.
Which destinations are driving the most revenue this quarter, not just the most bookings.
High booking volume on low-margin packages can look busy while barely moving the needle on profit.
Marketing channel performance.
Which channel, Google Ads, Instagram, referrals, is producing enquiries that actually convert into paying clients, versus which one just generates cheap but low-quality leads.
Seasonal booking patterns.
Trends across previous years laid out visually, so pricing, staffing, and marketing spend can be planned ahead of demand instead of reacting to it after the fact.
Average deal size and trend.
Whether average booking value is growing or shrinking, broken down by package type, destination, or even by which staff member closed the enquiry.
Conversion rate from enquiry to booking.
How many enquiries actually turn into paid bookings, and where in that funnel leads are being lost.
How the data actually gets connected
The technical setup is more approachable than most agency owners expect.
Booking and enquiry data, wherever it currently lives, gets piped into Power BI and refreshed on a schedule, daily or even in real time depending on the source.
The output is a single dashboard the whole team can open on a laptop or a TV screen in the office, not a spreadsheet that only one person knows how to maintain.
Why this matters beyond just "nicer reporting"
This is not a reporting nicety, it changes how fast a business can move.
Agencies with clear, live visibility into their numbers catch a dip in a specific route before it turns into a quarter-long slump, and they can confidently double down on what is actually working instead of what simply feels like it is working based on gut instinct.
Frequently asked questions
Can Power BI connect directly to a booking system or database?
Yes.
Power BI can connect to a wide range of data sources, including SQL databases like Supabase, spreadsheet exports, and many booking platforms, and refresh automatically on a schedule.
Do I need a data team to set up a Power BI dashboard?
No.
A well-scoped dashboard for a travel agency's core metrics, revenue, channel performance, seasonality, conversion, can be built as a focused project without an in-house data team.
How often does the dashboard update?
This depends on the data source and how it is connected, but daily or near real-time refreshes are standard for most travel agency use cases.
If your current reporting process is a spreadsheet someone dreads opening, that is usually the clearest sign it is time to turn it into a dashboard instead.
Get in touch to talk through what a Power BI dashboard could look like for your agency's data.
power bidata visualizationdashboardsbusiness intelligencetravel agency reporting
Work with me
Start a project →LET’S TALK
Have a project in mind after reading this? Send a brief and I usually reply within 24 to 48 hours.